
What four sensor readings can and can’t tell you about your soil
I don’t trust a single green light on a dashboard, never have, not once in twenty years of doing this, and I’m not about to start trusting one on a soil sensor just because the crop looks fine today. A dashboard that reports “healthy” on one KPI while three systems next to it are quietly drifting is just lying to you with extra steps, and the exact same discipline that taught me that in a SOC is the one I’ve been applying to the MBS SmartFarm Ecological Impact Index (MBS EII) since we started scoring soil the way you’d score risk.
That’s what this three-part series is, plain and simple: I’m going to work through the MBS EII the way a security engineer works through any composite score, raw telemetry first, then the biological systems that telemetry is standing in for, then the environmental variables that sit outside anyone’s control loop entirely. Part 1 is the metric itself.
So what are these four sensor readings actually telling us when we pull telemetry off a field?
The MBS EII’s Stage 5 “Thriving” classification comes off four sensor-derived readings, each scored against a band, and if you’ve spent any time around config baselines this will feel familiar:
- Moisture, 20-35%, the optimal band for loam soil, water available in the root zone
- Soil EC, 0.8-2.0 dS/m, optimal, dissolved salt concentration, a proxy for nutrient load
- Soil temp, 15-25°C, ideal, thermal conditions for root and microbial activity
- Soil pH, 6.0-7.0, ideal, the acid/alkaline balance that governs whether nutrients are even usable
Take a hypothetical reading of moisture 27.5%, EC 1.4 dS/m, temp 20°C, pH 6.6, and it doesn’t just clear each band, it sits close to the mid-point of all four at once, and that’s the part people skim past without understanding why it matters. A pass/fail model treats 20.1% moisture the same as 34.9%, both just “optimal,” but a model that scores proximity to center treats the mid-band reading as materially more stable, because it’s got room to move on both sides before it drifts into trouble.
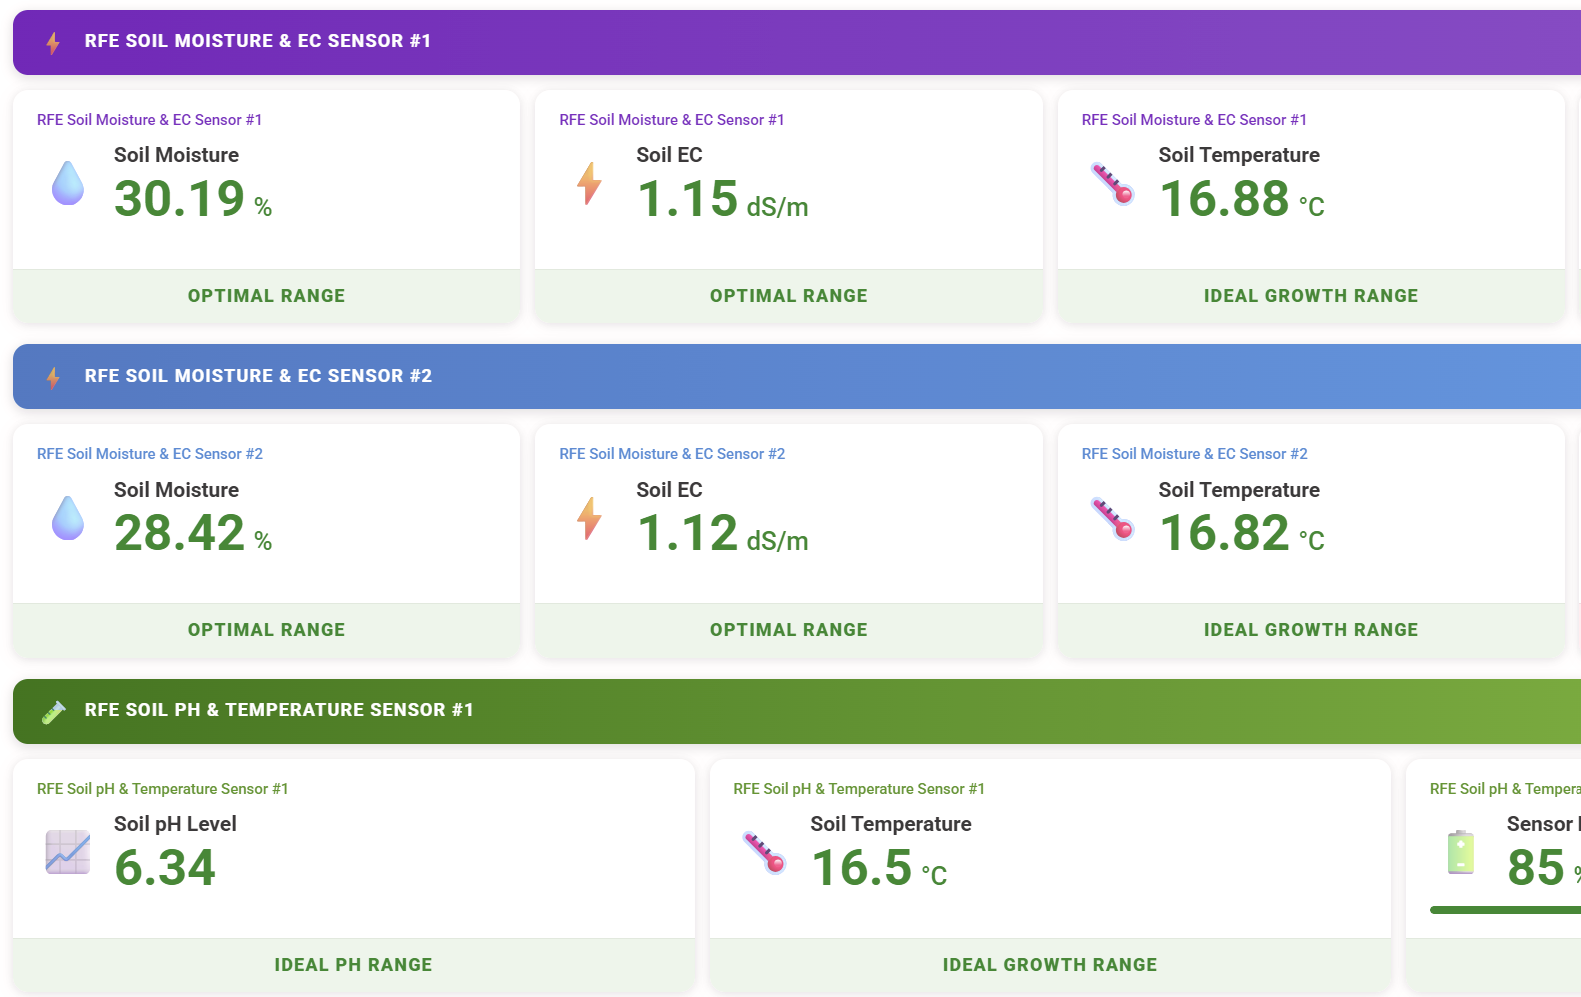
And here’s the thing about edge-band readings, because I see this constantly: an edge-band reading is a system running at capacity with no headroom left. EC sitting at 1.95 dS/m is technically inside “Optimal,” sure, but one fertigation event, one rain pulse changing the dilution, and you’re in “Elevated” before you’ve even finished your coffee. EC at 1.4 has room to absorb that same event and stay put. The buffer is the whole point. A metric that only tells you pass or fail is hiding exactly the information that tells you whether today’s pass survives to tomorrow’s reading. Which brings me to the RFE dashboard, and I want to be careful here because a naive read of it teaches you the wrong lesson. That deployment scored 93, Stage 5, Thriving, off pH 6.34, EC 1.15 dS/m, temp 16.88°C and 30.19% average moisture, all three sitting comfortably inside their bands. But the score is 93, not 100, and that gap is the model telling you it isn’t just checking boxes. Underneath those three abiotic numbers, the soil biology sub-scores, beneficial bacteria at 97%, mycorrhizal fungi at 98%, saprophytic fungi at 98%, earthworm activity at 94%, are doing real work in that composite. Which is exactly where Part 2 picks up, because the four abiotic readings I’ve just walked you through are necessary conditions. They are not sufficient ones.